The cumulative fatigue distribution curve
Cumulative fatigue curve for Rosters
You can also see the cumulative fatigue curve in the Rosters screen. Unlike the cumulative fatigue curve in Schedules screen, which is focused on the fatigue number of the selected schedule, the curve in Rosters screen shows a combined curve for all schedules in a roster.
The cumulative fatigue distribution curve is a useful curve to indicate the number of fatigue scores that are in evidence throughout the schedule. This curve shows the score distribution across the scale your company administrator has set for this instance.
You will also notice various data points across the curve. If you hover over a data point in a curve, you will see the a fatigue score based on the scale set for this instance. This score is for a schedule type (a pilot or a cabin crew). Below the score, you can see the percentage of scores that are below that score.
The vertical line which goes from the top to the bottom of this chart shows the threshold set by your company administrator for each schedule type.
Image from Rosters screen
The image below is a snapshot of the fatigue curve taken from the Rosters screen. This roster had multiple schedules and schedule types that is why the curve is showing two different lines for different schedule types - pilots and the cabin crew. The fatigue curve in Schedules screen will only show a single line and is specific to the the selected schedule.
In the image below, the curve shows distribution for the schedules that fall into bands between SP2 and SP3, SP3 and SP4, SP4 and SP5, and so on, on the Samn Perelli scale. The cabin crew threshold for this instance is set to 5.5 and the pilot threshold is set to 5. The cursor sits at SP score 6.1 and shows that 96.1% of the scores are below that score. It also shows that to get 100% under the threshold, it should be set at above SP6.7, which is too high.
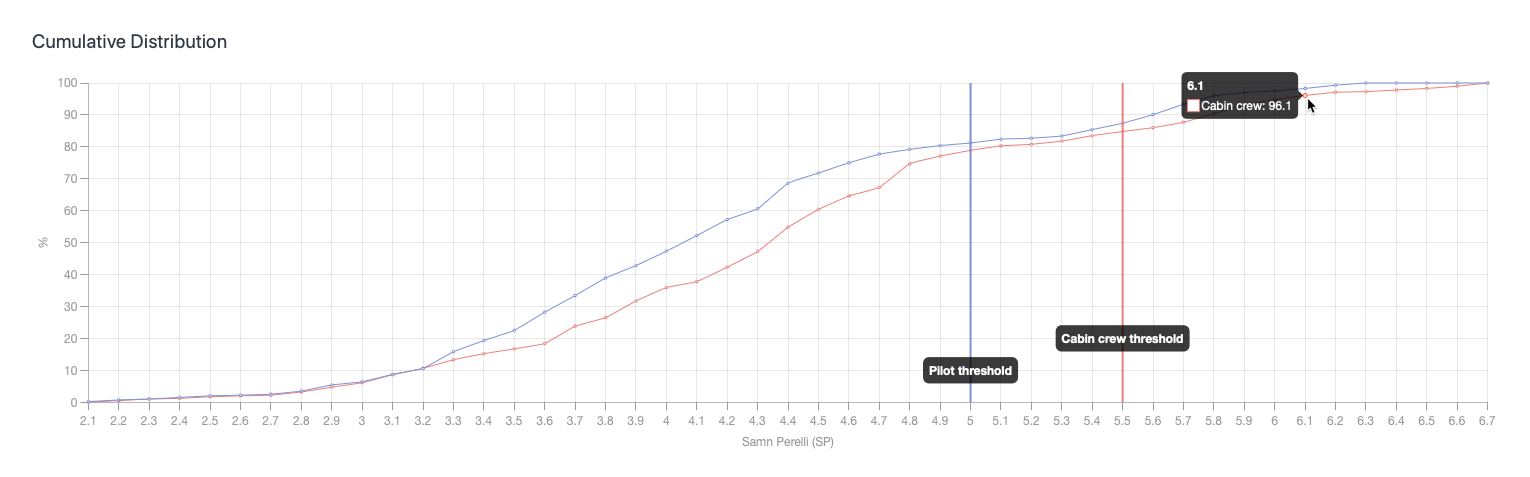
This curve demonstrates an overall level of “goodness” in terms of the design of the schedule as it illuminates the risks inherent in the schedule in a simple chart.