The overview chart
This chart provides a picture of the rising and falling fatigue throughout each duty.
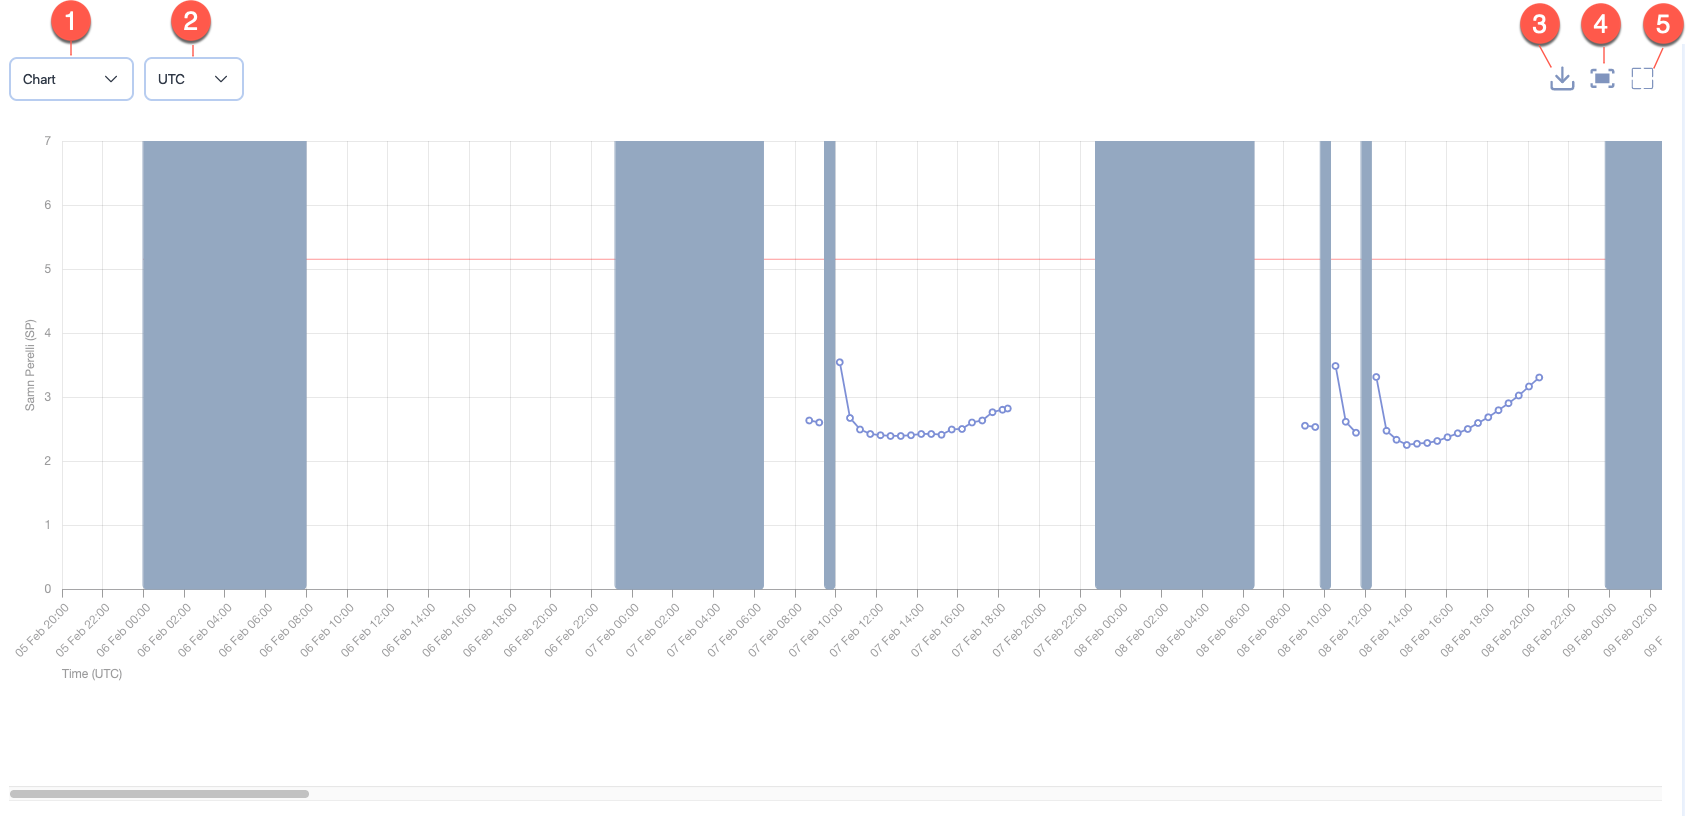
Note the tools for the Overview screen: from left to right:
- The Chart dropdown lets you choose between chart and report modes.
- The Time reference dropdown lets you choose whether the overview chart should be in UTC or base time.
- The Download icon lets you download the chart or the report.
- The Fit to Screen icon attempts to fit the chart or the report data within the visible area and hides the scroll bar for the chart or the report data.
- The Maximise icon maximises the report or the data to fill most of entire browser screen.
- After you click on the Maximise icon, the icon is replaced by a Minimise icon.

- Click on the Minimise icon to toggle the chart or report data to the original size.
- After you click on the Maximise icon, the icon is replaced by a Minimise icon.