The sleep reservoir curve
The sleep reservoir curve below shows sleep in terms of a reservoir that is full at the end of a good sleep period and then dissipates with time awake, just like a water reservoir. It indicates the growth of the sleep propensity to sleep as a lower sleep reservoir, which falls in harmony with the circadian rhythm that in turn stimulates the need to sleep.
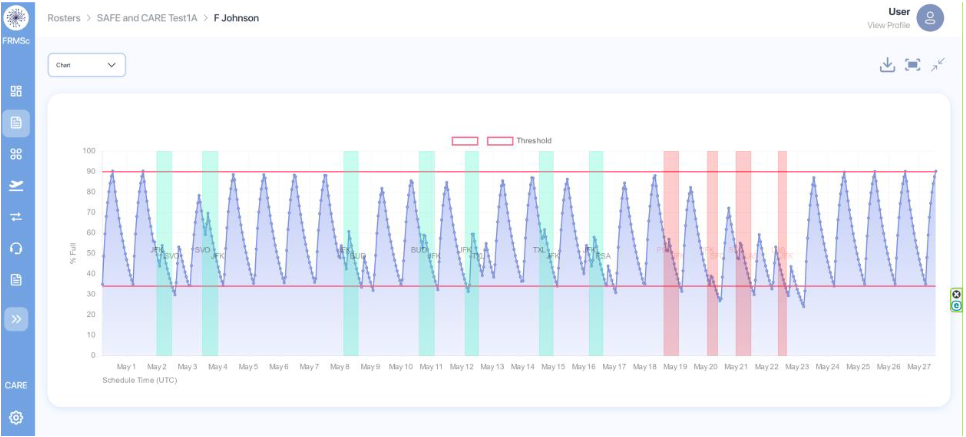
The group of three icons to the top right indicate a pdf download is available, the curve can be fitted to the width of the screen and the maximised screen can be minimised to return it to the original format.
The longer the time awake the more the reservoir drains of sleep, and this drives a greater propensity to sleep. Note that the red lines indicate normal waking (upper line) and normal sleep (lower line) points. Note the times where the reservoir falls below the reserve set by the lower red line indicating the aircrew are staying awake beyond their normal bedtime.
It can be seen amongst the red duties that indicate a breach of the fatigue threshold, to the right of the display, that the sleep reservoir has fallen below the normal time of sleep onset and does not reach the normal time of wakening, indicating lack of sleep from both causes.